


Power Analysis and Sample Size Estimate
Calculate Upper and Lower bounds for your Sample size


Type of Statistical Test:
Single Sample T-test
Assumptions:
Test Statistic Distribution: Student’s t-distribution
Population Standard Deviation is Unknown
Data is Approximately Normally Distributed
Purpose: to compare the mean of a sample to a known value
Hypothesis Test: Single Sample T-Test
Types of Errors & their Probabilities:
In hypothesis testing we can make two types of errors:
Type I error: Rejecting the Null hypothesis when it is True (False Positive error)
Type II error: Failing to Reject the Null hypothesis when it is False (False Negative error)
The probability of a Type I error is pre-determined by the Significance Level α.
The probability of a Type II error (β) generally cannot be computed because it depends on the population mean which is unknown.
Statistical Power:
Probability of Correctly Rejecting the Null hypothesis when it is False.
Power = 1 — β
What is Effect & how is it related to α, β and Power:
“Effect” is a way to understand how much of an effect an intervention or treatment has, or how much one variable influences another, often measured as “effect size”. Effect size quantifies the magnitude of an observed effect. Effect size complements statistical significance tests. While p-values tell us if a result is statistically significant (unlikely to be due to chance), effect size tells us how meaningful or practically important that result is. A statistically significant result with a small effect size might not be practically important, while a large effect size, even if not statistically significant, might still be meaningful.
Re-defining α, β and Power in terms of Effect:
α : probability of claiming an effect which is not there (by incorrectly rejecting the null hypothesis)
β : probability of missing an effect which is really there (by incorrectly failing to reject the null hypothesis)
Power : ( 1 — β ) : probability of detecting an effect which is really there (by correctly rejecting the null hypothesis)
Effect Size:
There are many ways to compute effect size. We will follow the “Mean Difference” method (known as Cohen’s d) — the difference between the means of two groups, often divided by the standard deviation. For a Single Sampled test this is computed as:
Cohen’s d = ( m — μ ) / s
m → sample mean
μ → theoretical mean
s → sample standard deviation
Effect Size buckets:
< 0.1 → Trivial Effect
0.1–0.3 → Small Effect
0.3–0.5 → Moderate Effect
> 0.5 → Large Effect
Because effect size can only be calculated after you collect data from program participants, you will have to use an estimate for the power analysis.
Common practice is to use a value of 0.5 as it indicates a moderate to large difference.
Relationship between Power, Effect Size and Sample Size:
Power, effect size, and sample size are interconnected in statistical analysis; larger sample sizes generally lead to higher power, and a larger effect size also increases power, allowing for easier detection of a true effect.
A study with high power is more likely to find a statistically significant result when there is a true effect, while a study with low power may fail to detect a real effect.
A larger effect size indicates a stronger or more meaningful effect, while a smaller effect size suggests a weaker or less important effect.
A larger sample size generally provides more statistical power, as it reduces the variability of the sample estimates and allows for more precise estimation of the effect.
In a nutshell:
Larger Sample Size, Higher Power: For a given effect size, a larger sample size will lead to higher statistical power.
Larger Effect Size, Higher Power: For a given sample size, a larger effect size will lead to higher statistical power.
Power Analysis:
As Power, Effect Size and Sample Size are inter-related, for desired values of power and effect size we can compute the required sample size. To ensure that our sample size is big enough, we will need to conduct a “Power Analysis”. As these calculations are not easy to do by hand, we take the help of a software program G*Power. G*Power is a free, user-friendly software tool for performing statistical power analyses, including sample size calculations, for various statistical tests.
Details of the Power Analysis parameters:
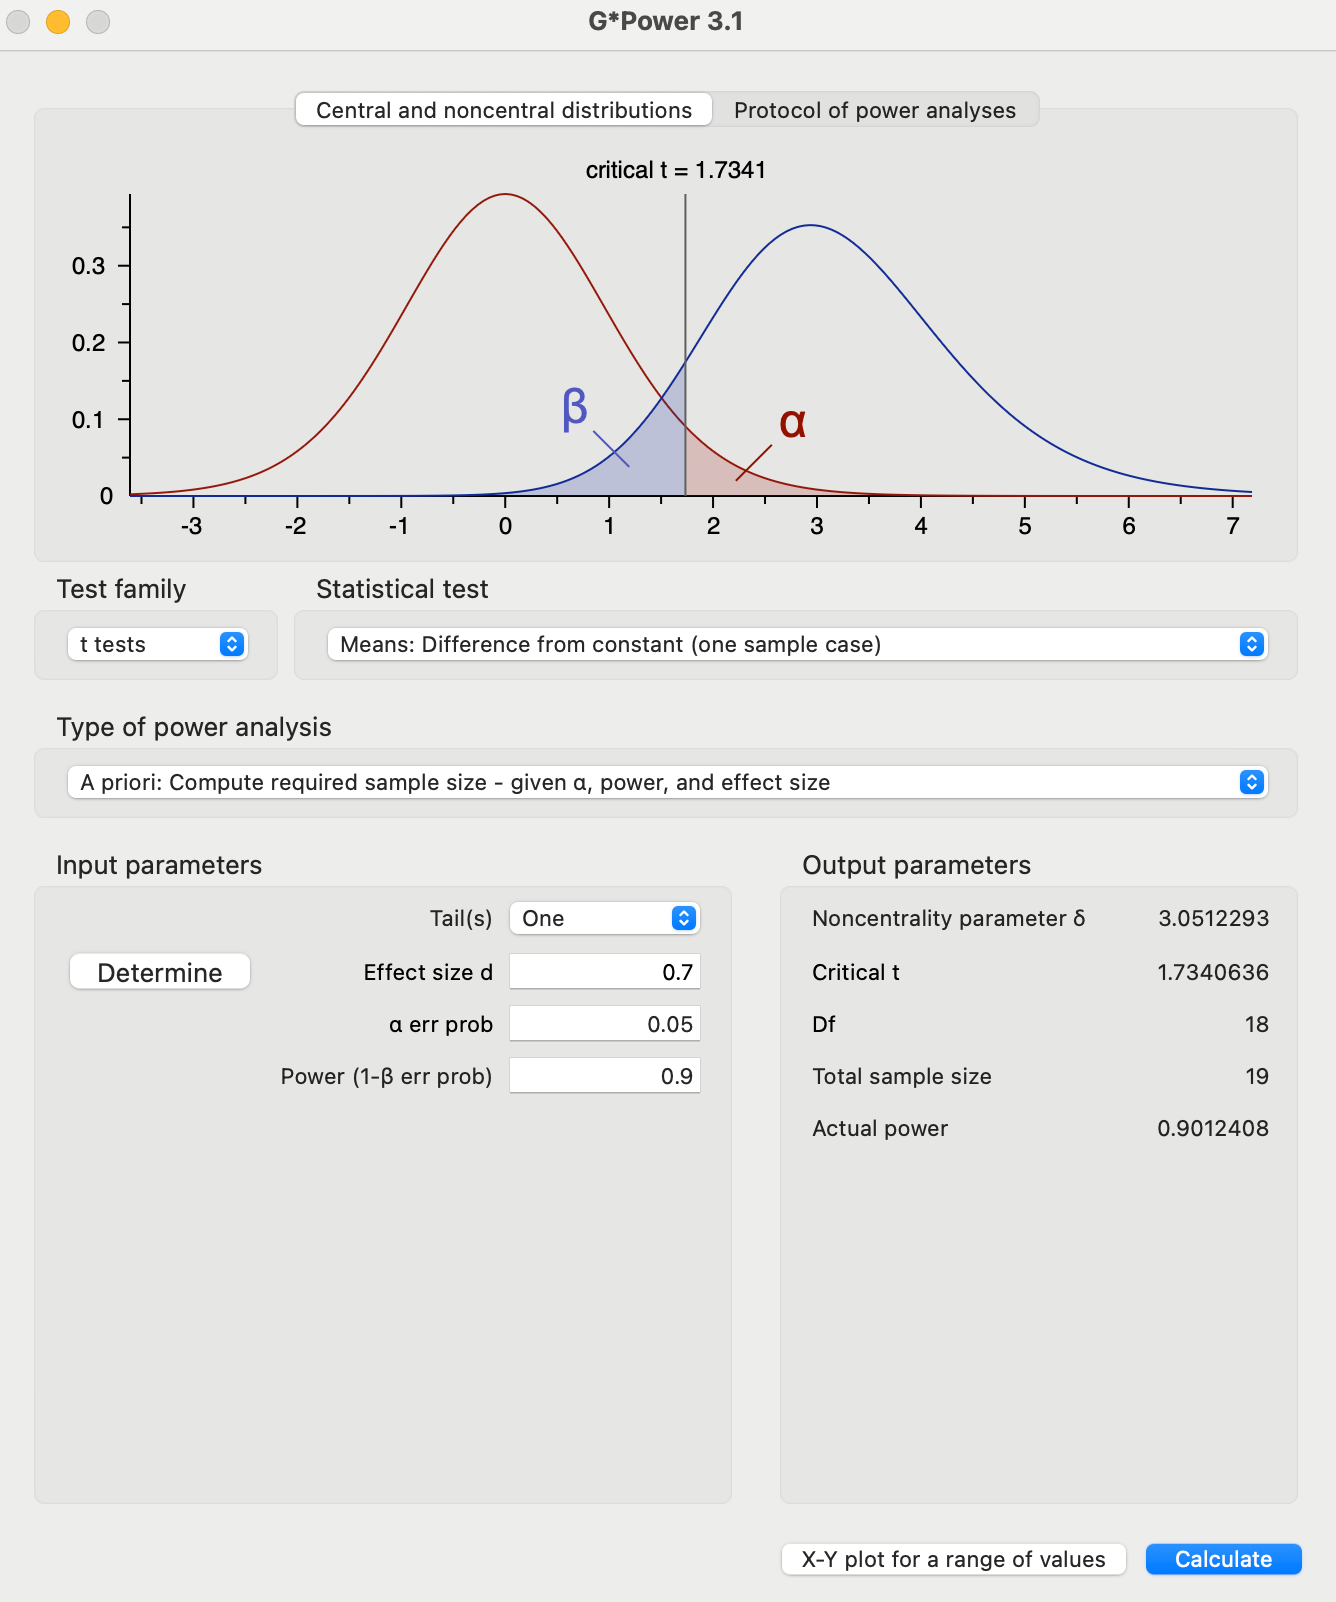
Test Family : t-tests
Statistical Test : Means: Difference from constant (one sample case)
Type of Power Analysis : A priori: Compute required sample size — given α, Power and Effect Size
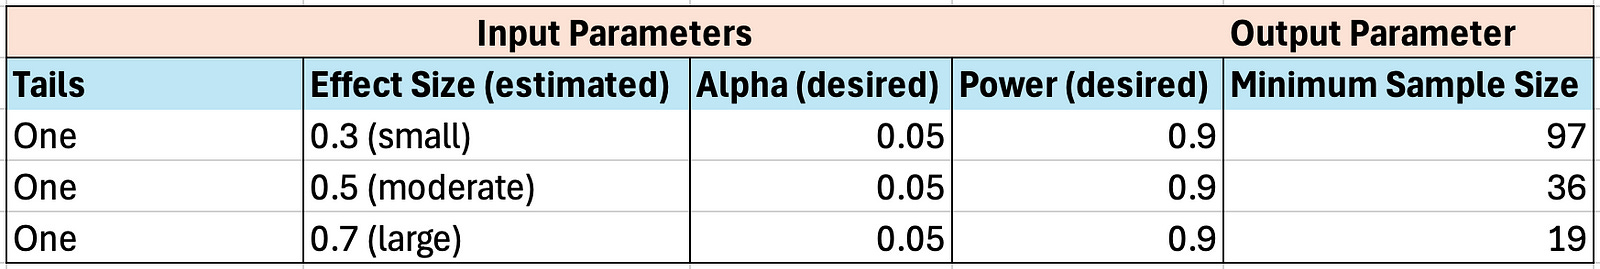
Input Parameters & Corresponding Output:
G* Power:
Effect Size : Small

Effect Size : Medium

Effect Size : Large
Conclusion:
Estimated Range of Sample Size:
Upper Bound:
For a small effect size, we need to have a sample which is large enough to detect the smallest effect size of interest — but not so large — because large sample size can make even small effects look statistically significant — but this does not mean the effect should be practically important.
Keeping in mind the above points and the G*Power computed sample sizes, we can consider the following Upper Bound on sample size:
sample size <= 97 (sample size large enough to detect the smallest effect size of interest)
Lower Bound:
For a moderate effect size, we need to have a sample which can be small — because even small sample size can detect a moderate to large effect easily.
Keeping in mind the above points and the G*Power computed sample sizes, we can consider the following Lower Bound on sample size:
sample size >= 36 (minimum sample size if we consider a moderate effect size)
Combining the above two we get:
sample size >= 36
sample size <= 97